opponents will test cowboys defense in the run game

boozeman

Draft Pick
Messages
3,859
Reaction score
0
And again ******, if they were running it "better" why would they not run it "more?

The smart teams do.

Most of the playoff teams from last year ranked at the bottom half of passing percentages.

The highest was Atlanta at 7 and Indy at 9. GB was 14th, Cincy 17th, NE 19th, Denver 21st. The two Super Bowl teams were 20 (Baltimore) and 30 (SF). Washington was 31 and Seattle was dead last.

But please. Continue.

I'll start for you: It's a passing league.
 

dbair1967

Administrator
Messages
61,336
Reaction score
11,244
The highest was Atlanta at 7 and Indy at 9. GB was 14th, Cincy 17th, NE 19th, Denver 21st. The two Super Bowl teams were 20 (Baltimore) and 30 (SF). Washington was 31 and Seattle was dead last.

Seattle and Washington had rookie QB's starting, SF had a mediocre QB start week one, then replaced him later in the season with a 2nd yr QB. None of these teams QB's had played on traditional NFL style passing offenses in college either. In addition, while their passing attempts may have been down in terms of the rest of the league, their yds per attempt were all at the highest in the league (all 3 in the top-4). All 3 of these teams also had more passing TD's than rushing tds.
 

Iamtdg

2
Messages
5,614
Reaction score
0
:lol

dbair: ~sticks fingers in ears~ "nuh uh teams don't try to run that much anymore!!! If the cowboys stop the first couples of runs each game, then teams won't try to smash the mouth cuz more passing."

:lol
 

boozeman

Draft Pick
Messages
3,859
Reaction score
0
In addition, while their passing attempts may have been down in terms of the rest of the league, their yds per attempt were all at the highest in the league (all 3 in the top-4).

And why was this? Oh yeah, they didn't treat the run like an unnecessary afterthought.
 

bbgun

Administrator
Messages
15,275
Reaction score
2,520
Adam says it's a passing league. How dare you serfs defy stat boy.
 

dbair1967

Administrator
Messages
61,336
Reaction score
11,244
Passing vs rushing numbers over the years.

1977 (Last yr of 14 game schedule, also the year before a number of rules were altered for the first time to favor the passing game)

Number of teams averaging 30 or more rushing attempts per game- 28 (EVERY team). 8 teams actually averaged more than 40 rush attempts per game. Number of teams averaging 30 or more pass attempts- 1 (ONE)

1978 (First yr of 16 game schedule, first yr of new passing game rules)

Number of teams averaging 30 or more rushes- 28 (every team again). Only 3 averaged more than 40. Number of teams averaging 30 or more pass attempts- 2

1983- Number of teams averaging 30 or more rush attempts- 18 Number averaging 40 or more- 0
Number of teams averaging 30 or more pass attempts- 18

1988- Number of teams with 30+ rush attempts per game 16. Number with 40+ rush attempts 0
Number of teams with 30+ pass attempts 19

1992- Number of teams averaging 30+ rushes- 8. Number of teams averaging 30+ passes 14

1997- Number of teams averaging 30+ rushes- 7. Number of teams averaging 30+ passes 24

2002- Number of teams averaging 30+ rushes- 7. Number of teams averaging 30+ passes 24

2007- Number of teams averaging 30+ rushes- 7. Number of teams averaging 30+ passes 25 (Saints averaged 40+)

2012- Number of teams averaging 30+ rushes- 9 (4 of which had "spread" type QB's). Number of teams averaging 30+ passes 28 (4 over 40+)
 

Iamtdg

2
Messages
5,614
Reaction score
0
And again ******, if they were running it "better" why would they not run it "more? What you showed as "proof" for your argument was total yds rushing and yds per attempt, but didn't compare it to the same numbers for passing. The % of total yds gained league-wide rushing is DOWN. The % of rush attempts of all play calls is DOWN. Total yds averaged per team is WAY up.

Its a passing league. Teams pass more than they run.

I don't know how you cant understand this. I made a comment that having a smaller defensive front might not be as big a deal today as compared to sometime in the past, because the league as a whole passes more. Even the running game itself is different today because of how teams are doing it from a scheme standpoint.

In that chart booze posted teams have 3 times as many running attempts as 1961. We are running the ball 3 times as much now. 3 times as many attempts. So, if you take the number of running attempts from 1961 and multiply that number times 3 you get how many times the ball is run now. 3 times.
 

Iamtdg

2
Messages
5,614
Reaction score
0
Seattle and Washington had rookie QB's starting, SF had a mediocre QB start week one, then replaced him later in the season with a 2nd yr QB. None of these teams QB's had played on traditional NFL style passing offenses in college either. In addition, while their passing attempts may have been down in terms of the rest of the league, their yds per attempt were all at the highest in the league (all 3 in the top-4). All 3 of these teams also had more passing TD's than rushing tds.

So, we can't factor in yards per carry but we can factor in yards per catch? derp
 

Iamtdg

2
Messages
5,614
Reaction score
0
Oh, and before you bring up the %'s again, of course you get more yards when you throw it. Because you THREW it.
 

dbair1967

Administrator
Messages
61,336
Reaction score
11,244
In that chart booze posted teams have 3 times as many running attempts as 1961. We are running the ball 3 times as much now. 3 times as many attempts. So, if you take the number of running attempts from 1961 and multiply that number times 3 you get how many times the ball is run now. 3 times.

Unbelievable.
 

dbair1967

Administrator
Messages
61,336
Reaction score
11,244
Oh, and before you bring up the %'s again, of course you get more yards when you throw it. Because you THREW it.

Hey dipwad- is the % of pass attempts HIGHER or LOWER than rush attempts.

There are all kinds of stats quoted here in this thread. Quit ignoring them.

MORE PASSING TODAY. Hence "PASSING LEAGUE"
 

Iamtdg

2
Messages
5,614
Reaction score
0
4293994395_45c4b0b490_o.png


According to this chart, we have basically been a passing league since the 40's. With a small break in the early 80s. So, the argument that the NFL is just NOW a passing leagues is invalid.
 

dbair1967

Administrator
Messages
61,336
Reaction score
11,244
4293994395_45c4b0b490_o.png


According to this chart, we have basically been a passing league since the 40's. With a small break in the early 80s. So, the argument that the NFL is just NOW a passing leagues is invalid.

chart doesn't support your comment genius

yds per attempt doesn't= % of run v pass plays
 

Iamtdg

2
Messages
5,614
Reaction score
0
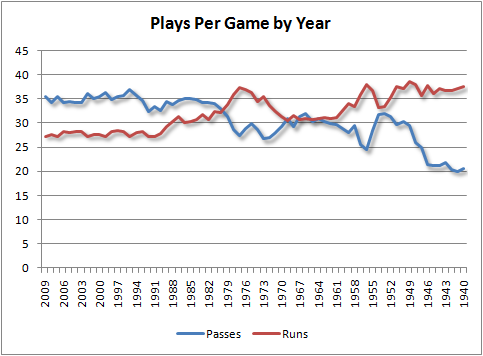
4294660554_9dc5b9ed59_o.png


And this chart shows that the league in 2009 had about the same number of passing attempts as in 1985. 30 years ago. But just now has the league turned into a passing league.
 

dbair1967

Administrator
Messages
61,336
Reaction score
11,244
This is from the article link I posted that apparently none of you geniuses read:

Year Pass Ratio Run Ratio
1970 48.27% 51.73%
1971 46.37% 53.63%
1972 44.36% 55.64%
1973 42.86% 57.14%
1974 45.47% 54.53%
1975 45.18% 54.82%
1976 43.83% 56.17%
1977 42.30% 57.70%
1978 44.43% 55.57%
1979 48.04% 51.96%
1980 50.60% 49.40%
1981 51.17% 48.83%
1982 52.57% 47.43%
1983 51.78% 48.22%
1984 53.10% 46.90%
1985 53.56% 46.44%
1986 53.70% 46.30%
1987 52.53% 47.47%
1988 52.76% 47.24%
1989 54.17% 45.83%
1990 53.96% 46.04%
1991 54.89% 45.11%
1992 54.20% 45.80%
1993 54.95% 45.05%
1994 56.03% 43.97%
1995 57.39% 42.61%
1996 55.67% 44.33%
1997 55.46% 44.54%
1998 55.17% 44.83%
1999 57.07% 42.93%
2000 56.21% 43.79%
2001 55.98% 44.02%
2002 56.70% 43.30%
2003 54.79% 45.21%
2004 54.88% 45.12%
2005 55.11% 44.89%
2006 54.85% 45.15%
2007 56.47% 43.53%
2008 55.43% 44.57%
2009 56.28% 43.72%
2010 56.93% 43.07%
2011 57.10% 42.90%
 

dbair1967

Administrator
Messages
61,336
Reaction score
11,244
4294660554_9dc5b9ed59_o.png


And this chart shows that the league in 2009 had about the same number of passing attempts as in 1985. 30 years ago. But just now has the league turned into a passing league.

Don't really understand how to read a graph do you?

This chart supports the statement I've made since the first page of this thread. % of passing plays is higher than % of rushing plays. And its completely flipped from where it was in the past, when it was a running league at one point.
 

Iamtdg

2
Messages
5,614
Reaction score
0
Don't really understand how to read a graph do you?

This chart supports the statement I've made since the first page of this thread. % of passing plays is higher than % of rushing plays. And its completely flipped from where it was in the past, when it was a running league at one point.

30 years ago the number of passing plays per game is the same as it is now.
 
Top Bottom